
A step by step manual for using our muscle segmentation
How to use the muscle segmentation framework
This page provides a comprehensive guide to the functions available in the SegmentationTools package, which is a part of the QMRITools library. The package is designed to assist in the segmentation of medical images, particularly muscles and bones. The tools include functionalities for preparing and visualizing data, defining and configuring various UNET architectures, and training neural networks for segmentation tasks.
The SegmentationTools package offers a range of functions that are organized into key categories:
- Data Visualization: Functions for viewing and checking data and segmentations.
- Data Preparation: Functions for processing and preparing data for segmentation tasks.
- UNet Configuration: Detailed tools for defining, configuring, and managing UNET architectures, including blocks and scaling features.
- Training Networks: Capabilities for training neural networks from scratch or continuing training from existing models.
- Using Networks: How to deploy the trained networks in the current framework.
General information
Each function is documented with its purpose, input parameters, and expected output, providing a clear understanding of how to use these tools effectively in your segmentation projects.
Within QMRITools masks are considered to be binary volumes only containing 0 and 1. Segmentations are considered to be multiple masks all with there own integer label.
To work with segmentations various functions have been implemented that can split into masks and the labels, extract specific labels, replace labels with other values combine segmentations and many more.
SplitSegmentationssplits the segmentation into masks and label numbers.MergeSegmentationsmerges masks into a segmentation. If no labels are provided they are automatically numbered.GetSegmentationLabelsextracts the labels that are present in the segmentation.SelectSegmentationsselects only the segmentation of the given labels.ReplaceSegmentationsreplaces segmentation labels with other label.SmoothSegmentationsmooths each of the individual segmentation using theSmoothMaskfunction.
For manually drawing ITKSnap is used. Therefore QMRITools has various default ITKSnap label files with standardized naming, numbering and coloring.
These files can be found in the installation folder of QMRITools in the folder “NeuralNetworks” and are also used for the naming and numbering in the segmentation framework.
- S1_Muscles_body_side.txt - full body muscles and bones (left and right separate). This is the default output of
SegmentData. - S2_Muscles_leg_side.txt - lower and upper leg and hip muscles and bones (left and right separate).
- S3_Muscles_shoulder_side.txt - shoulder muscles (left and right separate).
- S4_Muscles_arm_upper_side.txt - upper arm muscles (left and right separate).
- T1_Muscles_body.txt and T2_Muscles_leg.txt - the same muscles without left and right separation.
- N1 to N7 - the label sets used for training the networks per region (head and neck, shoulder, torso, hip, upper leg, lower leg and arm).
1. Data Visualization
To evaluate input or output data for training segmentation networks you want to be able to see and check the data. Therefore QMRITools comprises several useful visualization tools for displaying the data.
The main visualization function is PlotData which provides a data viewer with various options.
However for 3D segmentations the framework also contains a dedicated function for 3D visualization which is called ‘PlotSegmentations’.
PlotSegmentations[muscleSegmentation, boneSegmentation, voxelSize]
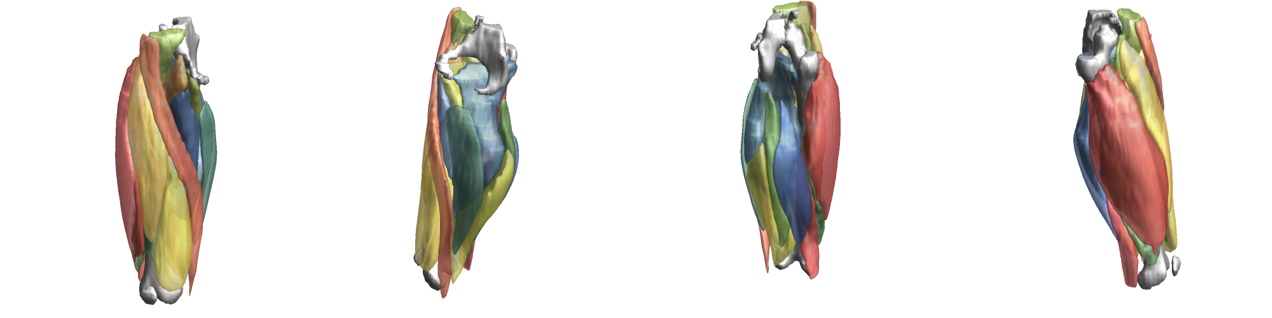
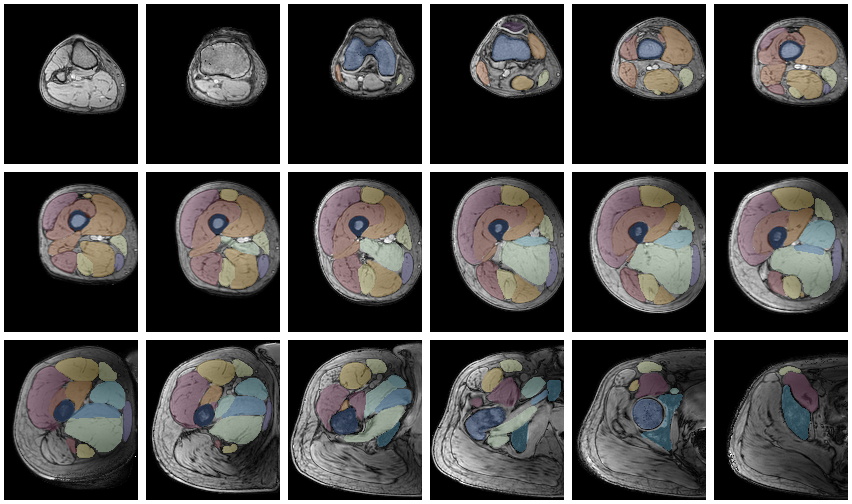
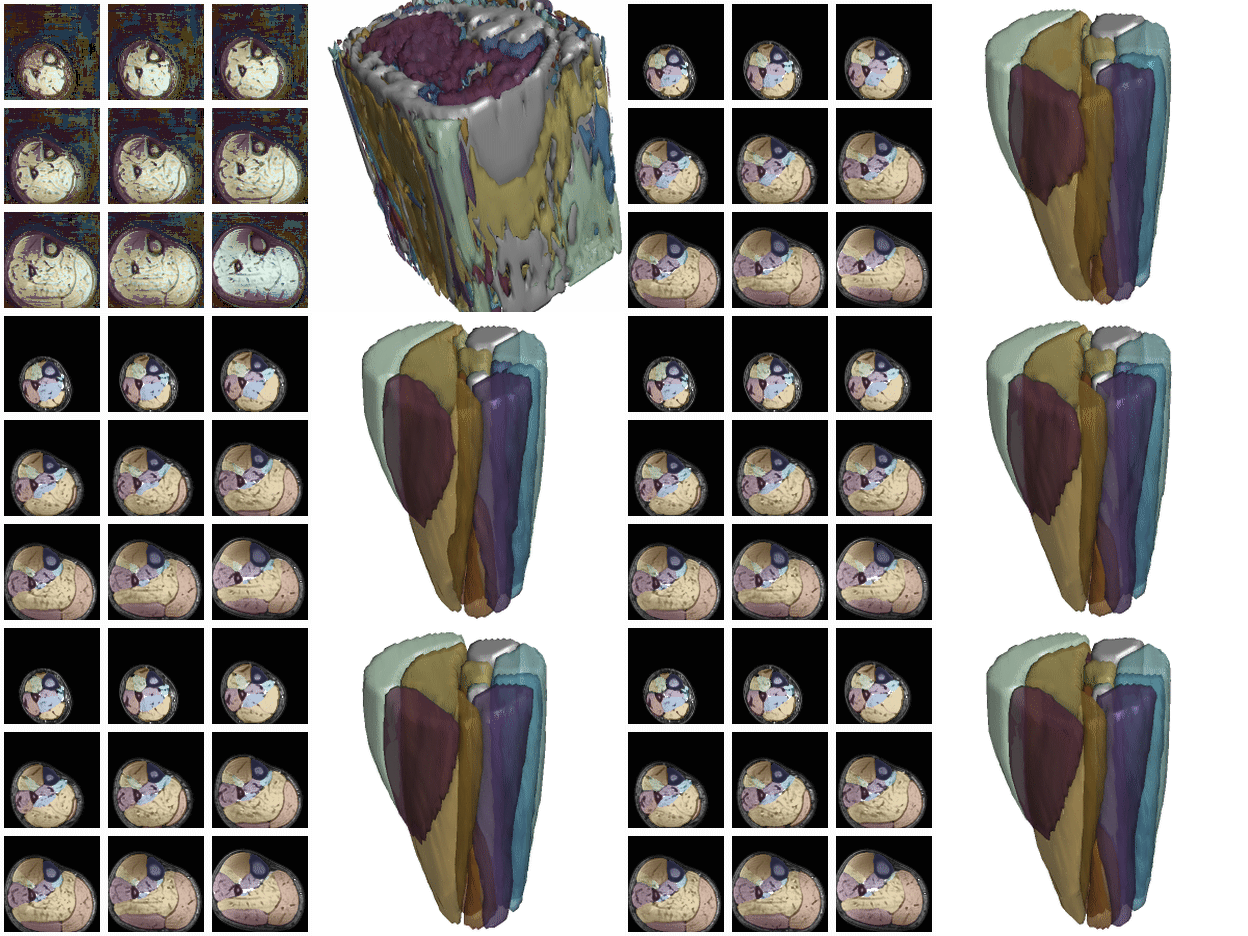
Another way to quickly evaluate the segmentation is using the ‘MakeChannelClassGrid’ which is also used to monitor network training. It takes a training data set with the corresponding labe and makes a image grid of the segmentations.
MakeChannelClassGrid[{data}, seg, {6, 3}]
2. Data preparation
When training networks one of the most important aspects is the quality of training data. although humans are, after some training, excellent in manually segmenting muscles they make mistakes and the slice tot slice variations can be apparent if one does not use semi-automated methods. Therefore the framework has functions for manipulating, smoothing and evaluating segmentations.
To train the network the data needs to be prepared and stored in a specific format in the training folder. For this the function PrepareTrainingData is used which checks the data quality and can also cleanup the segmentations if needed.
PrepareTrainingData[{segmentationFolder, dataFolder}, outputFolder,
  TestRun -> True, CleanUpSegmentations -> False,
  LabelTag -> "label", DataTag -> "data"]
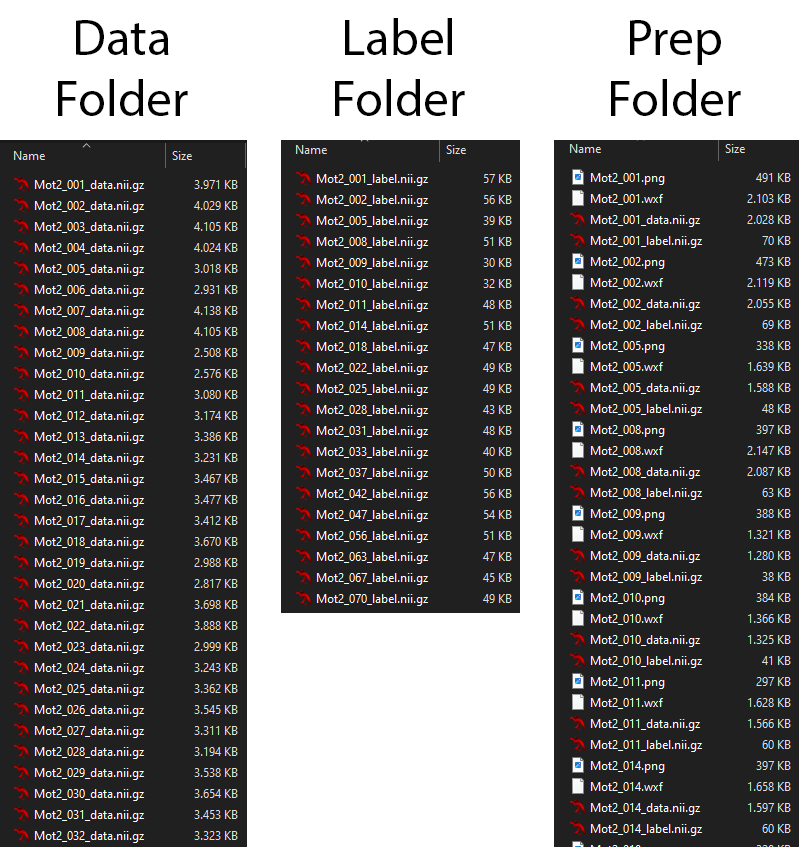
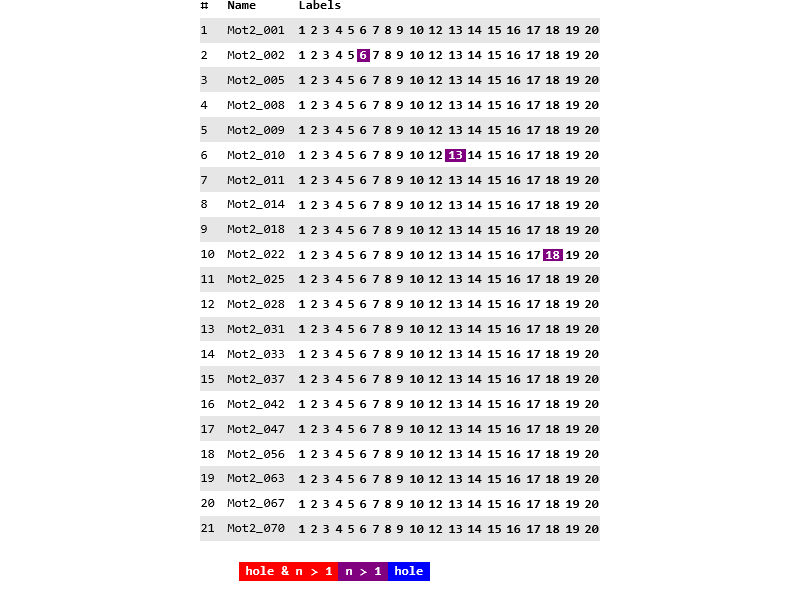
In the example below there are 21 datasets identified which all have 20 labels (excluding the background) of which a few segmentations that are not 1 continuous volume.
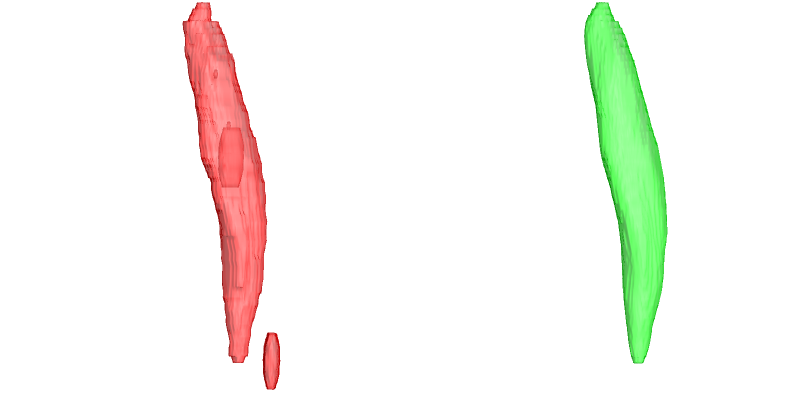
When segmentations contain mistakes or imperfections there are multiple functions that can help, where the most advanced and complete is SmoothSegmentation which allows to remove holes, select the number of segmentation components and allows for iterative surface smoothing. This is shown in the example below where the original segmentation has a hole, and additional volume and has a rough surface.
segOut = SmoothSegmentation[segIn, MaskComponents -> 1,
  MaskClosing -> 1, MaskDilation -> 0,
  MaskFiltKernel -> 2, SmoothIterations -> 3];
3. UNet Configuration
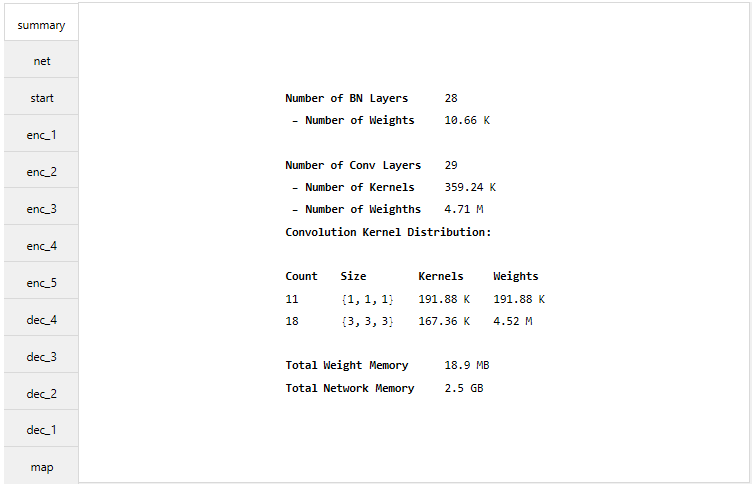
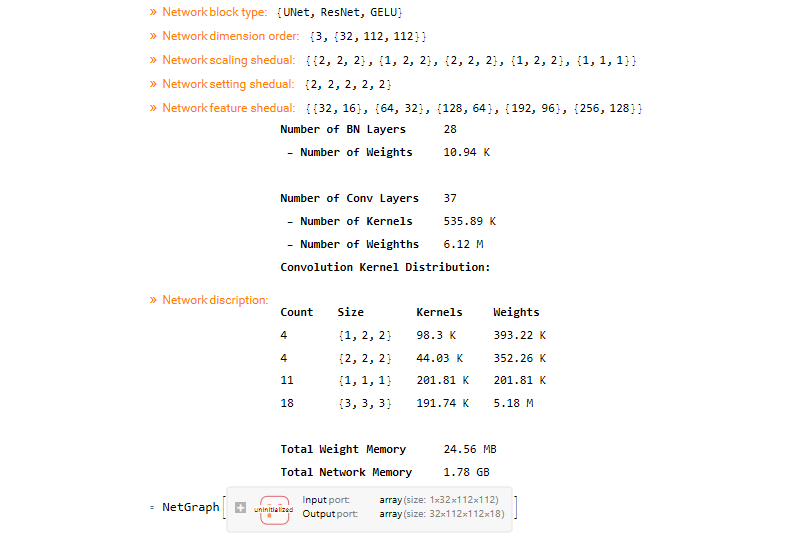
With the function MakeUnet a UNet is generated. The number of input channels, number of labels and the patch dimensions need to be given. With the function NetSummary a summary of the network can be given.
net = MakeUnet[1, 15, {32, 112, 112}];
NetSummary[net, "Full"]
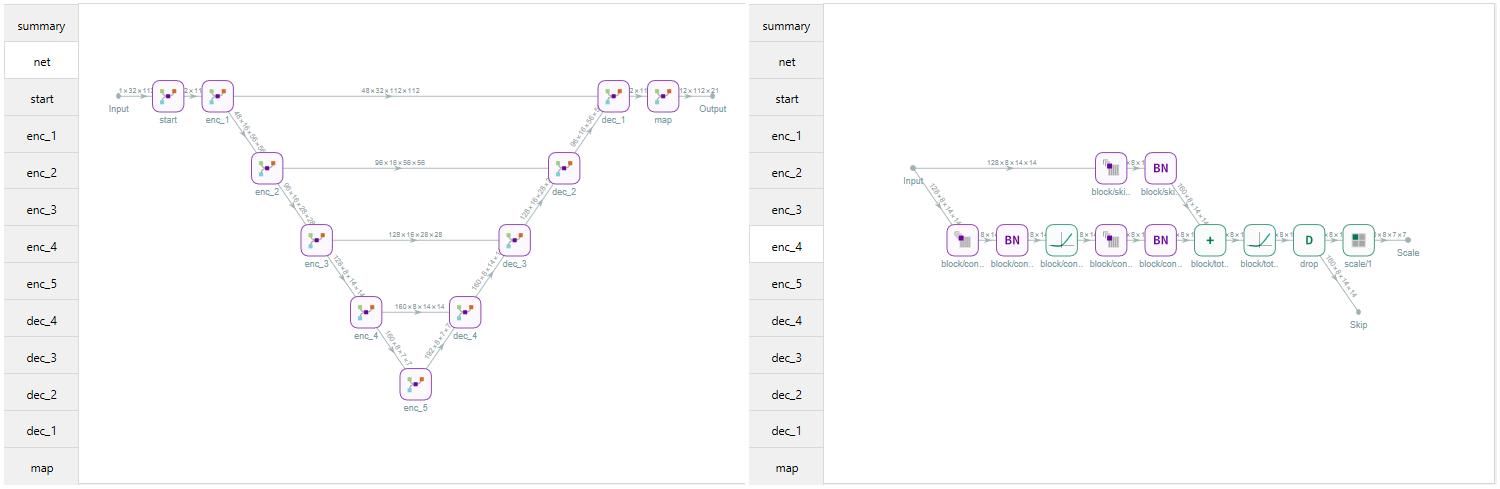
The UNet can be configured in various ways in both 2D and 3D in any depth needed. However for muscle segmentation 3D is much better. Most common activation layers are available and different scaling and features per layer can be configured. The UNet architecture can be UNet, UNet+, or UNet++. The blocks used in the network can be a choice of:
- Convolution block
- Default UNet block
- ResNet block
- DenseNet block
- U2Net block
- Inception Block
Downscaling can be done with pooling or with strided convolutions (RescaleMethod). The network generation functions are part of the NeuralNetworkTools.
Although there are many configuration options the recommendation is to use UNet architecture with ResNet blocks which is a right balance between reducing the weights and having enough network complexity that still easily fits the memory of most midrange GPUs for training.
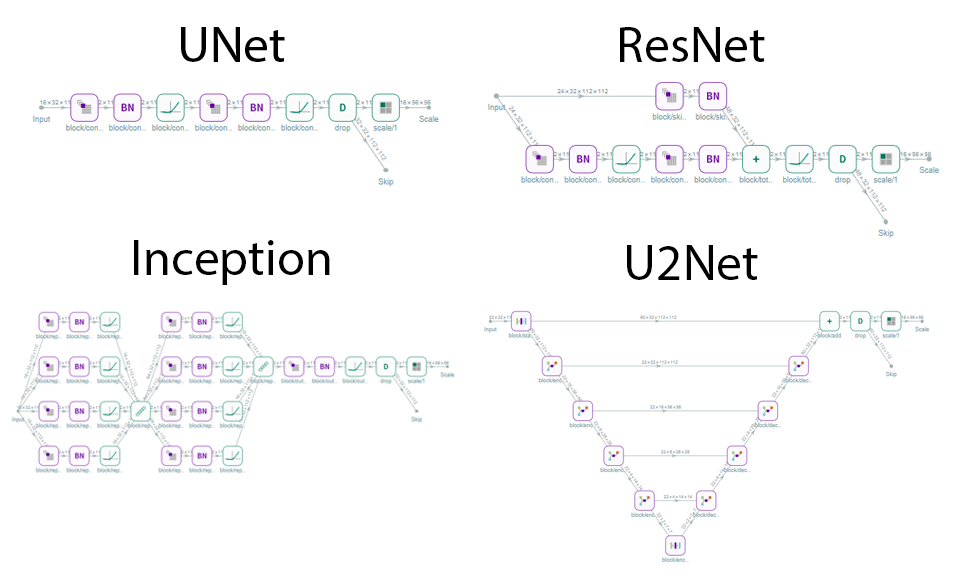
The configuration that is used for the networks provided with QMRITools is as given below.
MakeUnet[1, 18, {32, 112, 112},
  NetworkArchitecture -> "UNet",
  DropoutRate -> 0.2, ActivationType -> "GELU", BlockType -> "ResNet",
  SettingSchedule -> Automatic,
  FeatureSchedule -> {32, 64, 128, 192, 320},
  DownsampleSchedule -> { {2, 2, 2}, {1, 2, 2}, {2, 2, 2}, {1, 2, 2}, {1, 1, 1} }]
4. Training Networks
If all the data is prepared the training can begin. If the folder with the train data is created with PrepareTrainingData everything is set to go. With the following code the networks in QMRITools are trained. During the training a dynamic image of the training status is shown.
TrainSegmentationNetwork[{trainFolder, outputFolder},
  MaxTrainingRounds -> 150,
  LossFunction -> All,
  LearningRate -> 0.001, L2Regularization -> 0.0001,
  AugmentData -> True, DropoutRate -> 0.2,
  PatchSize -> {32, 112, 112}, PatchesPerSet -> 1,
  BatchSize -> 4, RoundLength -> 512,
  LoadTrainingData -> True, MonitorInterval -> 1,
  FeatureSchedule -> {32, 64, 128, 192, 320},
  DownsampleSchedule -> { {2, 2, 2}, {1, 2, 2}, {2, 2, 2}, {1, 2, 2}, {1, 1, 1} },
  BlockType -> "ResNet", NetworkArchitecture -> "UNet", ActivationType -> "GELU"
]
If the training is aborted by the user of for any other reason the training can be continues at any moment by specifying the outputFolder as a start position TrainSegmentationNetwork[{trainFolder, outputFolder}, outputFolder]. If no training has been performed but a pre-trained network is available this can also be used to start the training from TrainSegmentationNetwork[{trainFolder, outputFolder}, netFile].
Training can be sped up by loading and augmenting data in parallel background kernels (UseParallelKernels). Networks can be trained on multiple contrasts at once: MakeTrainData blends co-registered datasets (for example out-phase and in-phase, or water and fat) into the channels of one dataset, which is then used as data for PrepareTrainingData. During training a random channel is selected for each sample, which acts as contrast augmentation. For transfer learning to a new contrast or anatomy with little labelled data, a network can first be pretrained with self-supervised masked pretraining, which needs no labels (MaskedPretraining) and the encoder can be frozen during further training (FreezeEncoderLayers, FreezeEncoderDepth). See the usage of these functions and options in the documentation of the SegmentationTools guide.
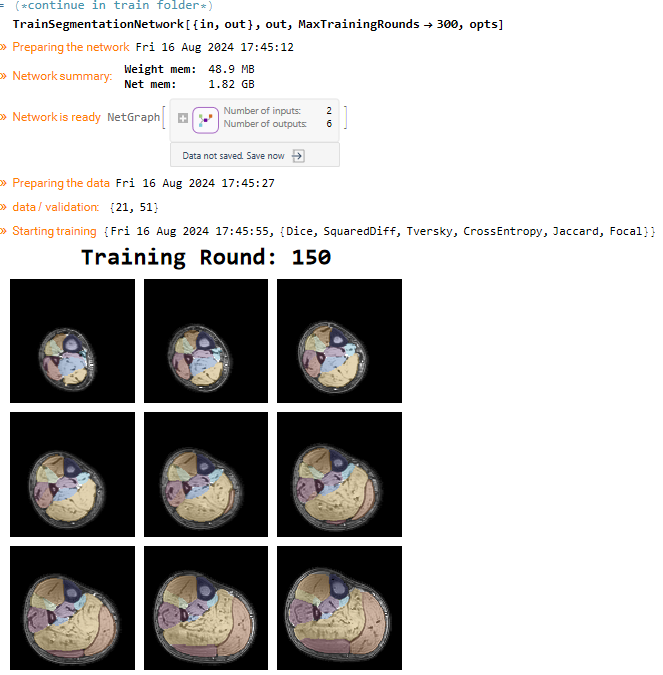
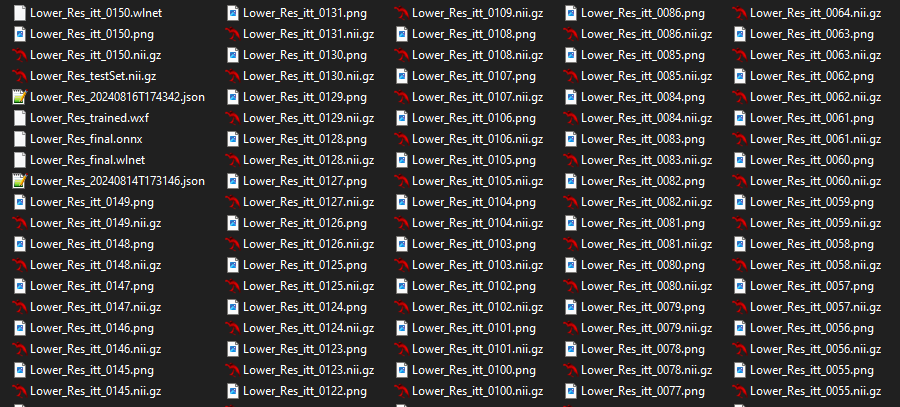
In the output folder all training progress is saved. When the training is initialized a test dataset will be made. For every iteration an progress image and segmentation data is made using this data. After each iteration the latest network is saved. If the training is completed a final network is also saved.
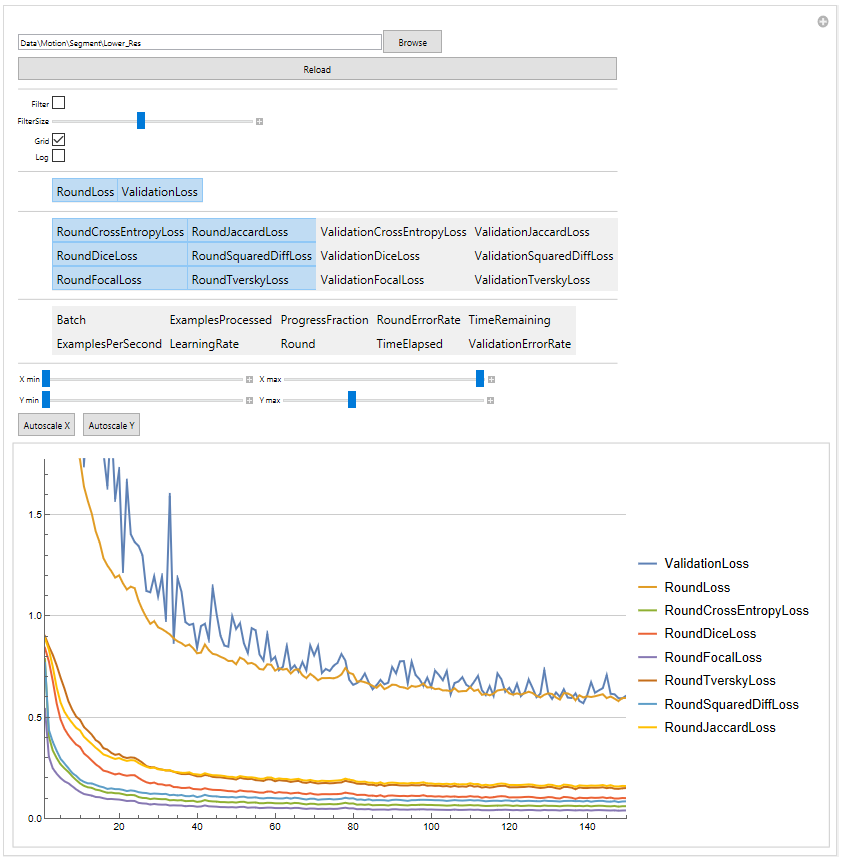
During the training the progress is saved in a logfile which can be viewed with the ShowTrainLog function.
Since during each training round the progress is saves as both images and segmentations stored as nifti files the framework allows to animate the training progress.
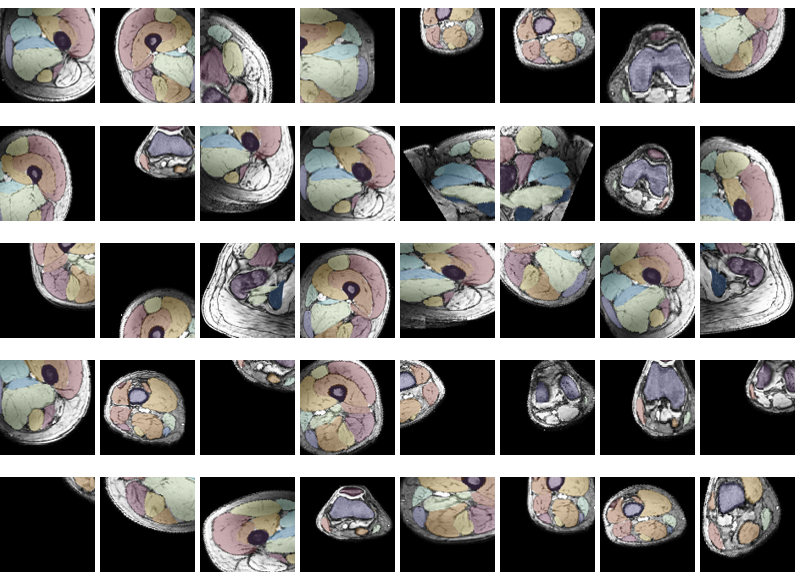
During the training the data is constantly augmented. The stored datasets are much larger than the patch used for training. Before a patch is selected from a random datasets the data is first augmented. The augmentation is one of 7 possibilities, flip LR, rotate (LR, AP, FH), and scale (LR, AP, FH). Each of these happens with a chance of 50%. The location where the patch is selected is also selected random. Therefore, the network hardly ever sees the exact same patch twice. Below are 40 training patches all selected from the same dataset.
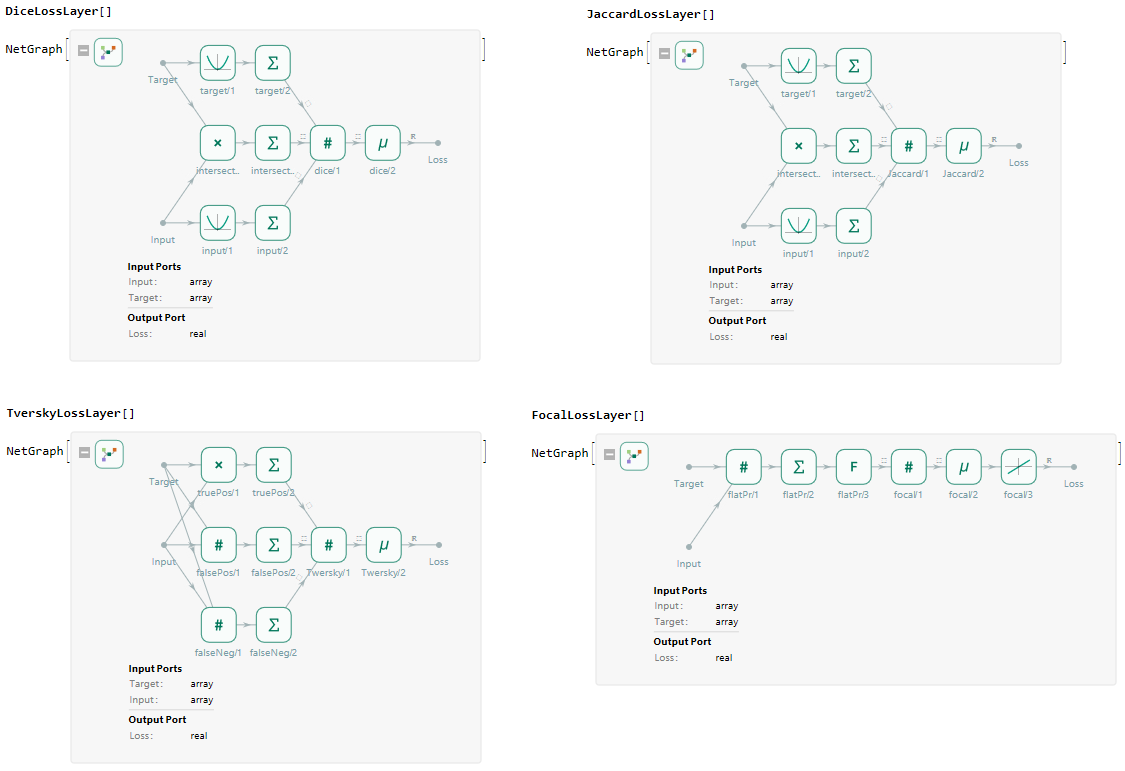
Next to the default loss layers available in the Wolfram Language the toolbox also contains various loss functions dedicated to training segmentation networks. Available loss layers are DiceLossLayer, JaccardLossLayer, TverskyLossLayer, FocalLossLayer, CELossLayer and TopKLossLayer, next to the Wolfram Language MeanSquaredLossLayer and CrossEntropyLossLayer. These layers are part of the NeuralNetworkTools.
5. Using Networks
To use the integrated segmentation pipeline the function SegmentData should be used. However if custom networks are to be used the function ApplySegmentationNetwork is available.
SegmentData can segment the full body or a specific region, for example SegmentData[data, "UpperLegsBody"], see the segmentation page for the available regions. For custom networks any network can be used with any data.
ApplySegmentationNetwork[data, network]
ApplySegmentationNetwork[{data1, data2, ...}, network]
ApplySegmentationNetwork[folder, network]
This will apply the segmentation network, which can be a NetGraph or a file name, to the given dataset list of datasets or all datasets in the folder.
For the evaluation of segmentation networks multiple similarity measures have been implemented. The main ones are DiceSimilarity, JaccardSimilarity, and SurfaceDistance. Two segmentations can be compared with CompareSegmentations.
The latter can calculate, amongst others, the mean, max, and 95% Hausdorff distance.
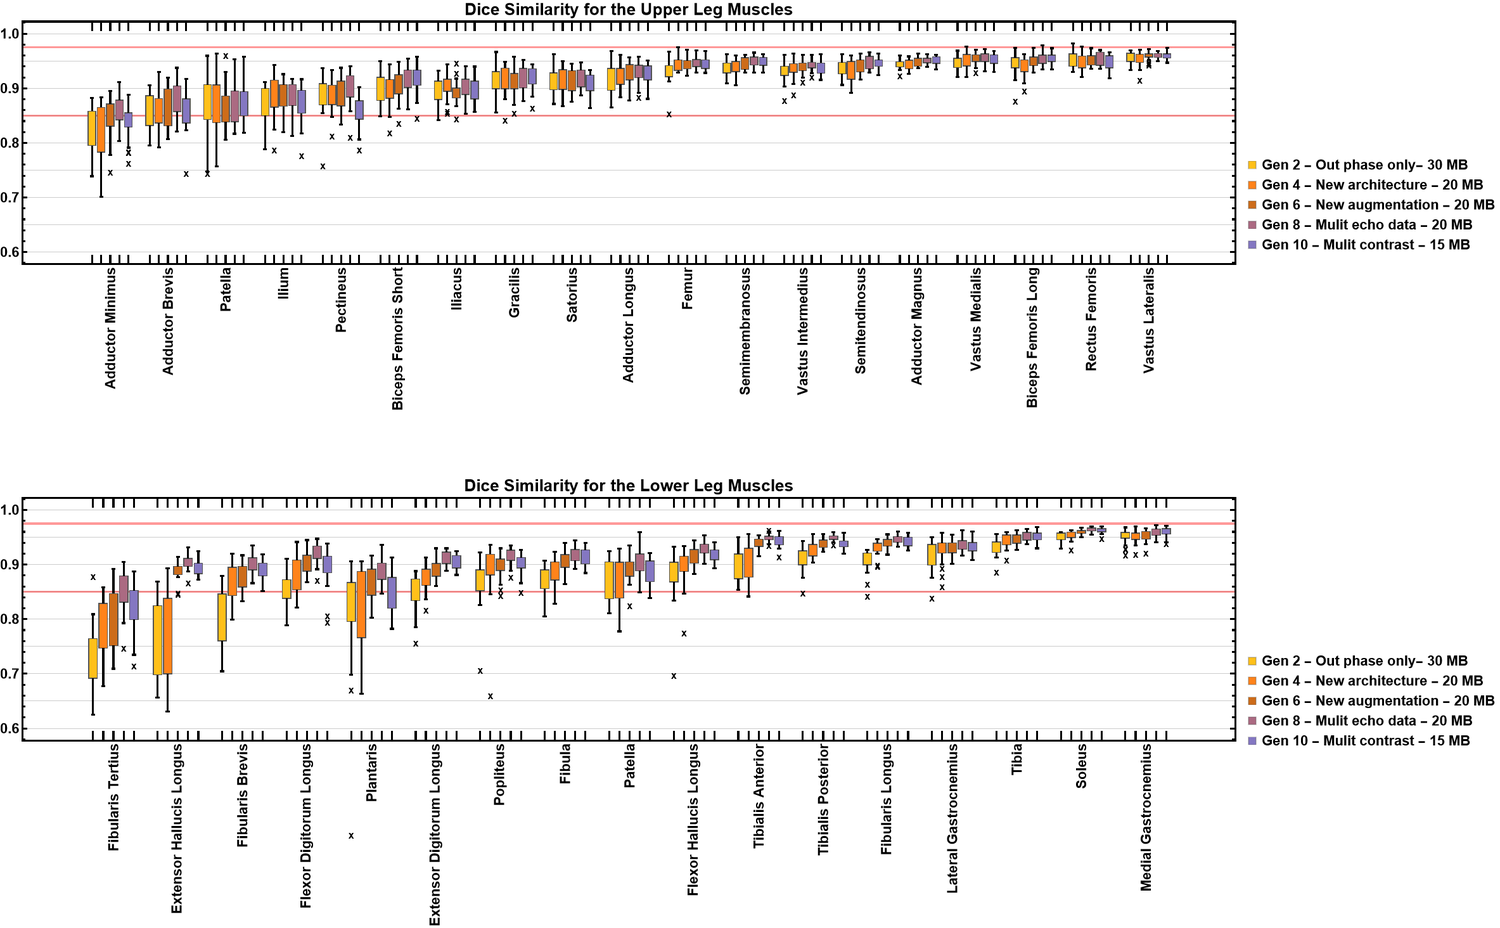
During optimization of the networks in QMRITools multiple architectures have been tested. Below you can see the performance for the dice similarity metic for the various generations of our segmentation networks, that become better every generation.
- How to use the muscle segmentation framework
- Muscle segmentation naming
- The available segmentation networks
- Script based segmentation without mathematica
- Automated muscle segmentation
We gratefully acknowledge the support of NVIDIA with the donation of GPU used for this work.